
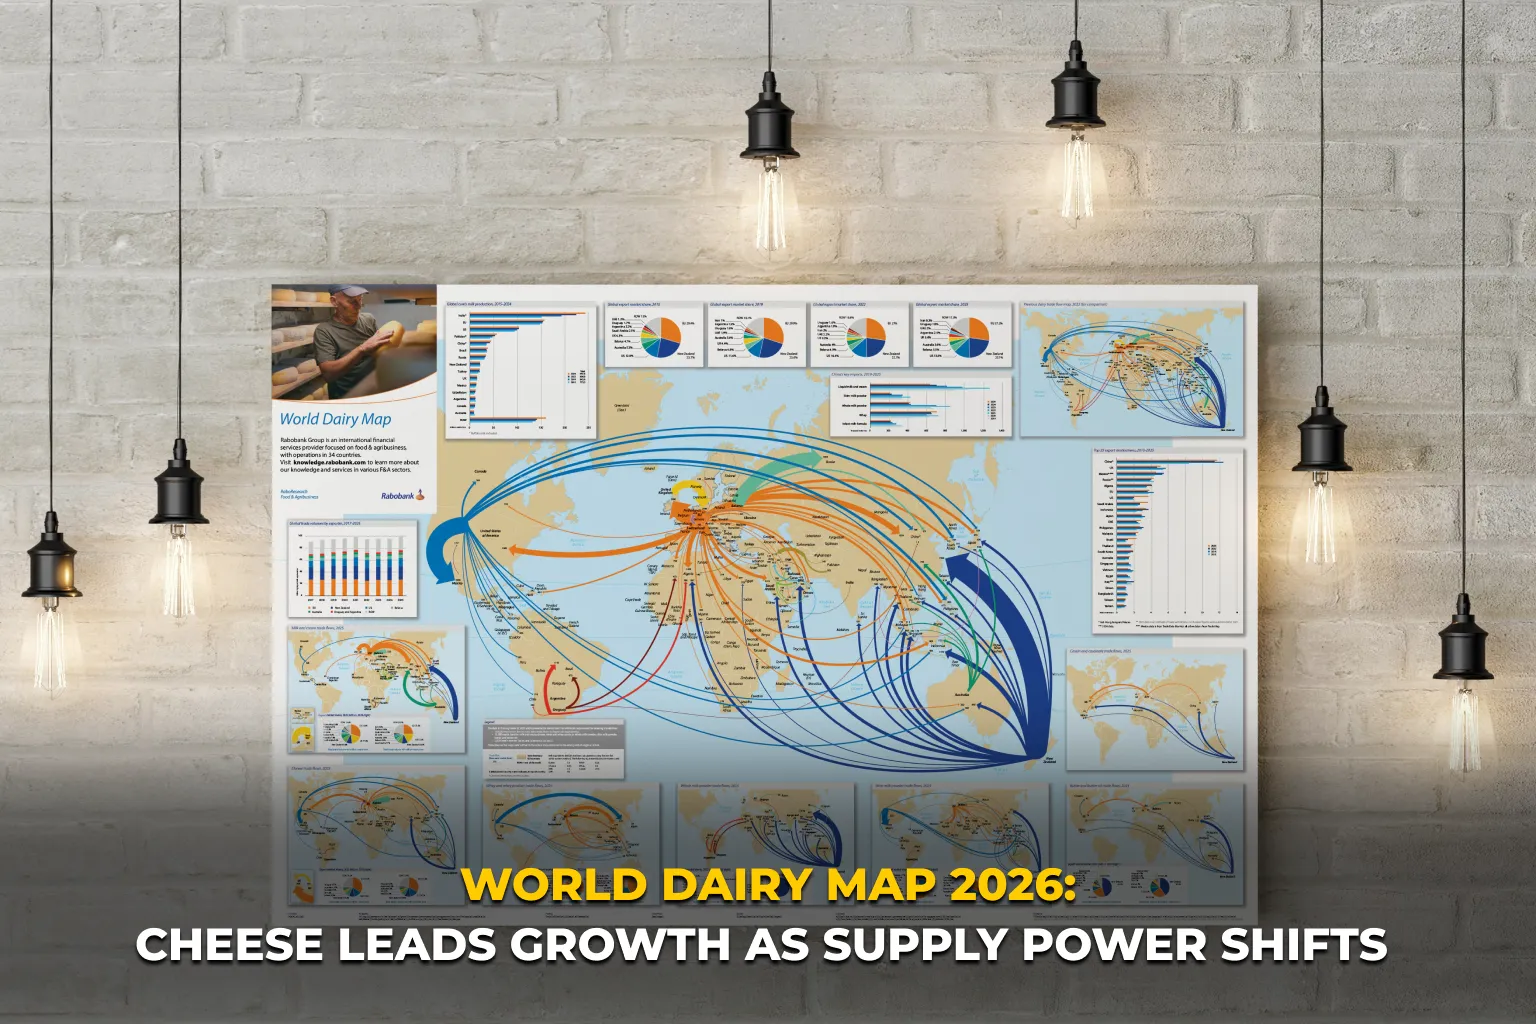
Global dairy trade keeps expanding along a long-term path of about 2% a year, but its dynamics are shifting: cheese leads the growth, weaker Chinese imports are redirecting flows toward emerging markets, and stronger US and Argentine supply is intensifying competition as Europe faces mounting milk-production constraints, according to RaboResearch’s new World Dairy Map 2026 by senior dairy specialist Tom Booijink, Rabobank reports.
Trade expands as flows shift
Global dairy trade grew 11% between 2017 and 2025, from 91.1 to 101.2 billion kg in liquid milk equivalents (LME) — about 2% a year.
The sharpest disruption came in 2022, when a nearly 4% drop in New Zealand milk output rippled through trade and pricing; a stronger 5% rise in 2025 then made up for a weak 2024.
The EU remains the largest exporter (27.5 billion kg LME in 2025, a 27% share), but its lead is slipping from nearer 30% in 2017.
New Zealand is the biggest single-country exporter (22%), while the US has grown from 11.3% to 13.5% of volumes since 2017 and Argentina plus Uruguay from 3.0% to 4.3%.
Demand moves from China to new hotspots
China (with Hong Kong and Macau) is still the top importer at 11.7 billion kg LME, but its purchases have fallen since a 2021 peak, with liquid milk, cream and milk-powder imports halving in four years amid stronger domestic output.
The Gulf is filling the gap — Saudi Arabia, the UAE and Oman are structurally reliant on imports, making the Strait of Hormuz ever more critical — while Southeast Asia is mixed (Malaysia and Thailand up, Vietnam and Indonesia slower).
Brazil is among the most dynamic, with imports rising from 1.3 billion kg LME in 2022 to 2.3 billion in 2025, mainly cheese and milk powders.
Cheese makes dairy trade tick
Liquid milk, powders, butter and whey
EU liquid-milk and cream exports fell from 1.53 to 1.24 billion kg since 2021 as EU shipments to China dropped from 750,000 to 250,000 tonnes; New Zealand overtook the EU as China’s No. 1 supplier from 2024.
The UK became a key outlet (imports up to 350,000 tonnes, largely from Ireland), and — stripping out China and the UK — EU liquid exports still grow about 2% a year. SMP exports rose just 0.5% in 2025, with US SMP down 6% a year, while WMP is subdued and the EU has retreated (387,000 to 172,000 tonnes since 2017) as it channels milk into higher-value products.
Butter jumped 9% to 2.23 million tonnes as US exports nearly tripled (45,000 to 123,000 tonnes). Whey volumes are flat near 3.5 million tonnes, but its value is climbing on protein demand tied to sports nutrition and weight-loss drugs.
Cheese and casein
Cheese is the standout: global trade reached 8.96 billion kg in 2025, up 40% since 2017 (a 3.3% annual rate that recently accelerated, doubling between 2024 and 2025).
Argentina and the US have doubled cheese exports since 2017, with the US now the second-largest exporter after the EU+UK; the EU lifted cheese output 9% and exports 12% despite only 5% more milk.
Casein is stable — up 1.4% in 2025, near its ~1.1% trend — with New Zealand and the EU vying for the lead (the EU narrowly first in 2025) and the US and China the main importers.
Who and what will power future trade
Europe’s role will stay important but increasingly constrained by regulation, an ageing farmer base and already-high yields.
The Americas look very different: Argentina swung from an 8% output decline in 2022–2024 to 10% growth in 2025 and 7% in Q1 2026, much of it flowing to Brazil, though its economy stays volatile.
The US offers a more predictable story — expansion supported by strong beef prices, protein demand (partly from GLP-1 drugs), a record 9.65-million-head dairy herd, a favourable cost position and a further 6% of cheese-processing capacity added in 2025.
India is not yet the export engine some expect, as extra milk is absorbed domestically. With whey a byproduct of cheese, cheese investment keeps accelerating and outpacing domestic markets, making exports ever more essential.
Tightening EU milk supply is a counterforce, but global trade should keep growing around 2% a year, with periodic volatility.
The full report and the map are available to download on the Rabobank website (map PDF).
Source: Rabobank